 Analytics
Insights for every interaction.
Analytics for the bigger picture.
See what sparked participation in every session, and understand how your teams use Pigeonhole Live across presentations, meetings and events.

See beyond attendance numbers
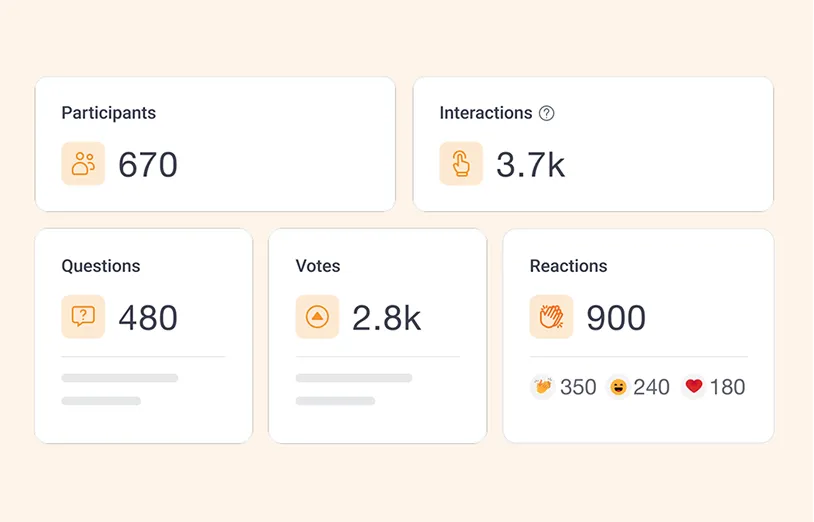
Track every interaction
Track questions, votes, responses, reactions and engagement session by session.
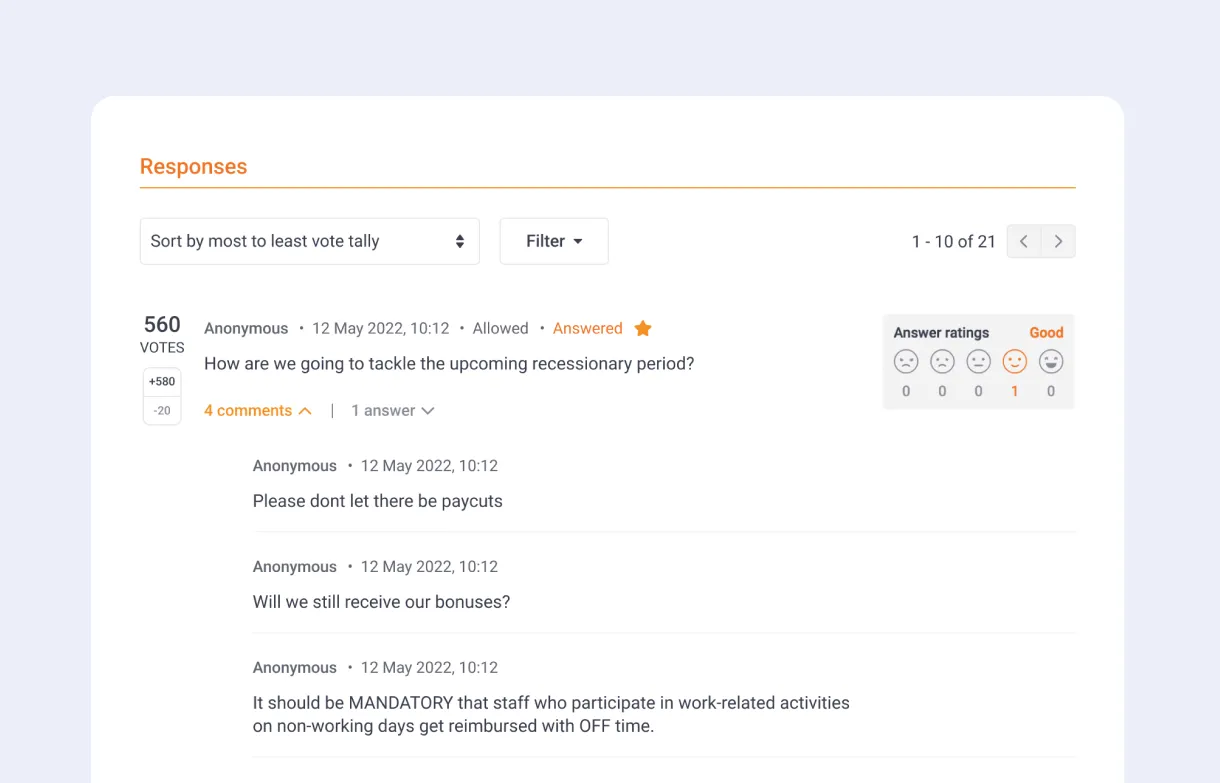
Understand your attendees
See how people feel with detailed attendee responses.
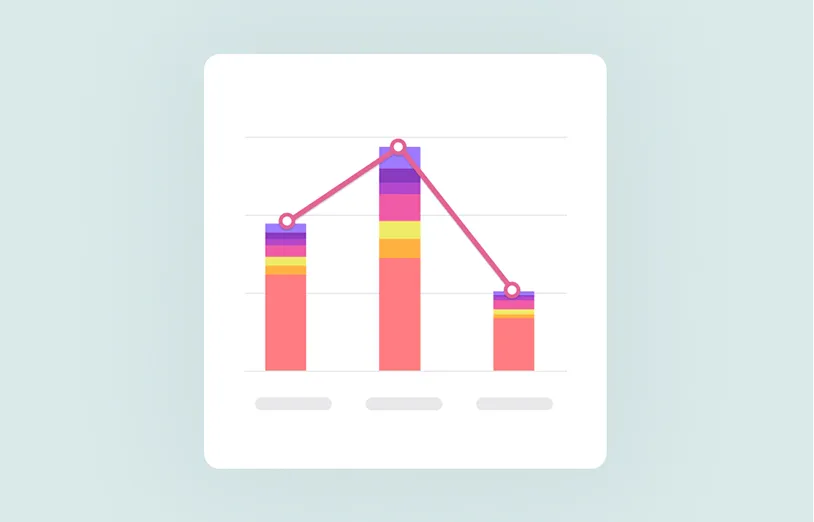
See the bigger picture
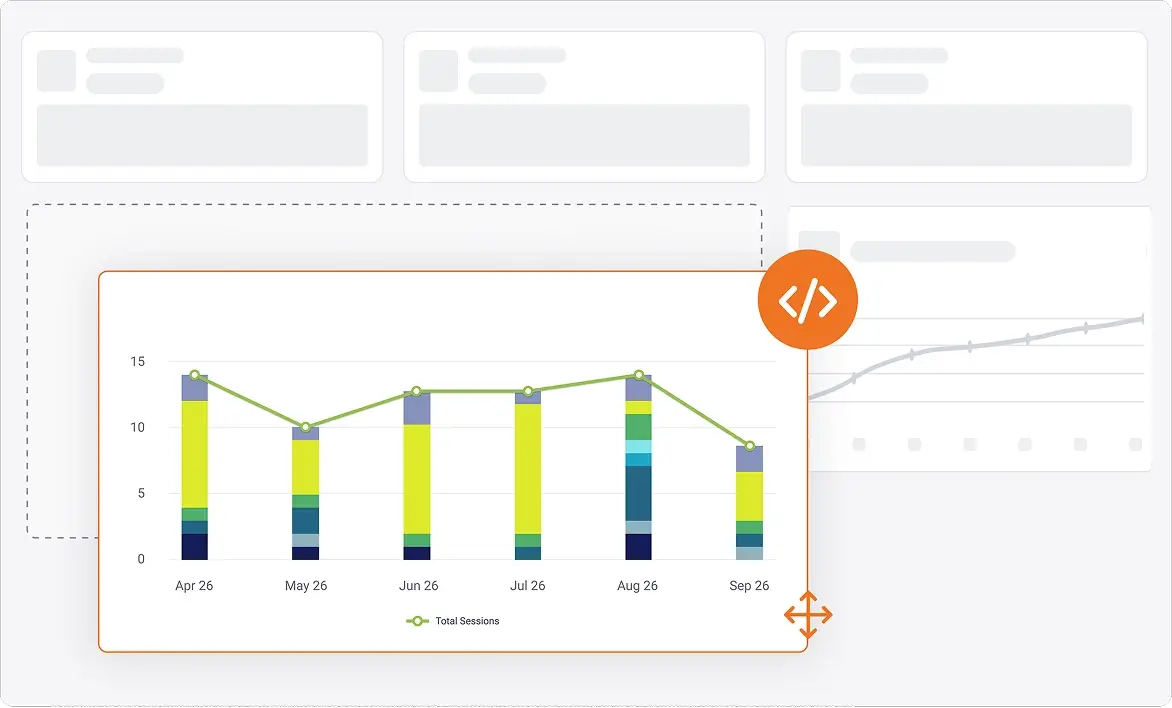
Track Workspace-wide usage patterns and participation trends over time.
Understand every Q&A interaction
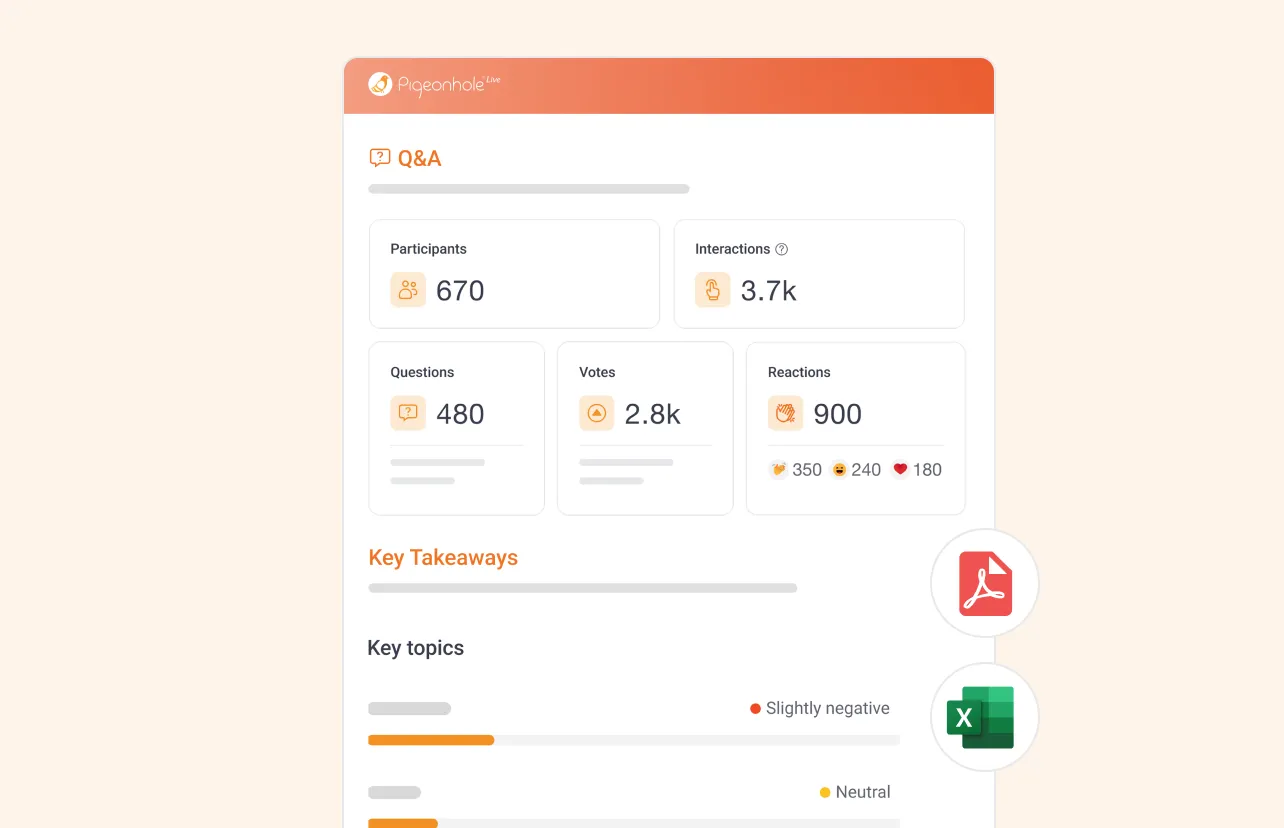
Track participation at a glance with detailed session-level insights — including participant count, questions submitted, votes received, questions answered, answer ratings and total interactions.
See which questions drew attention, which answers helped, and how Q&A shaped the session.
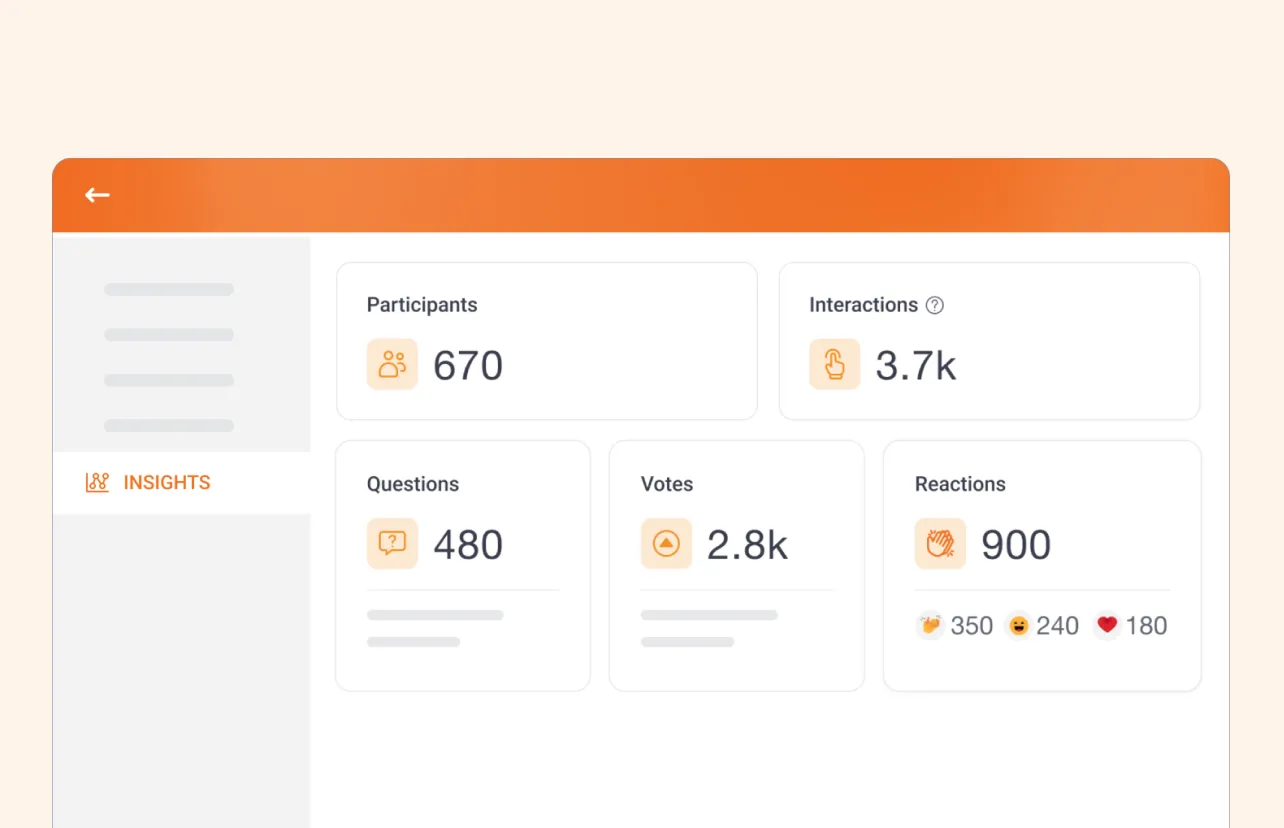
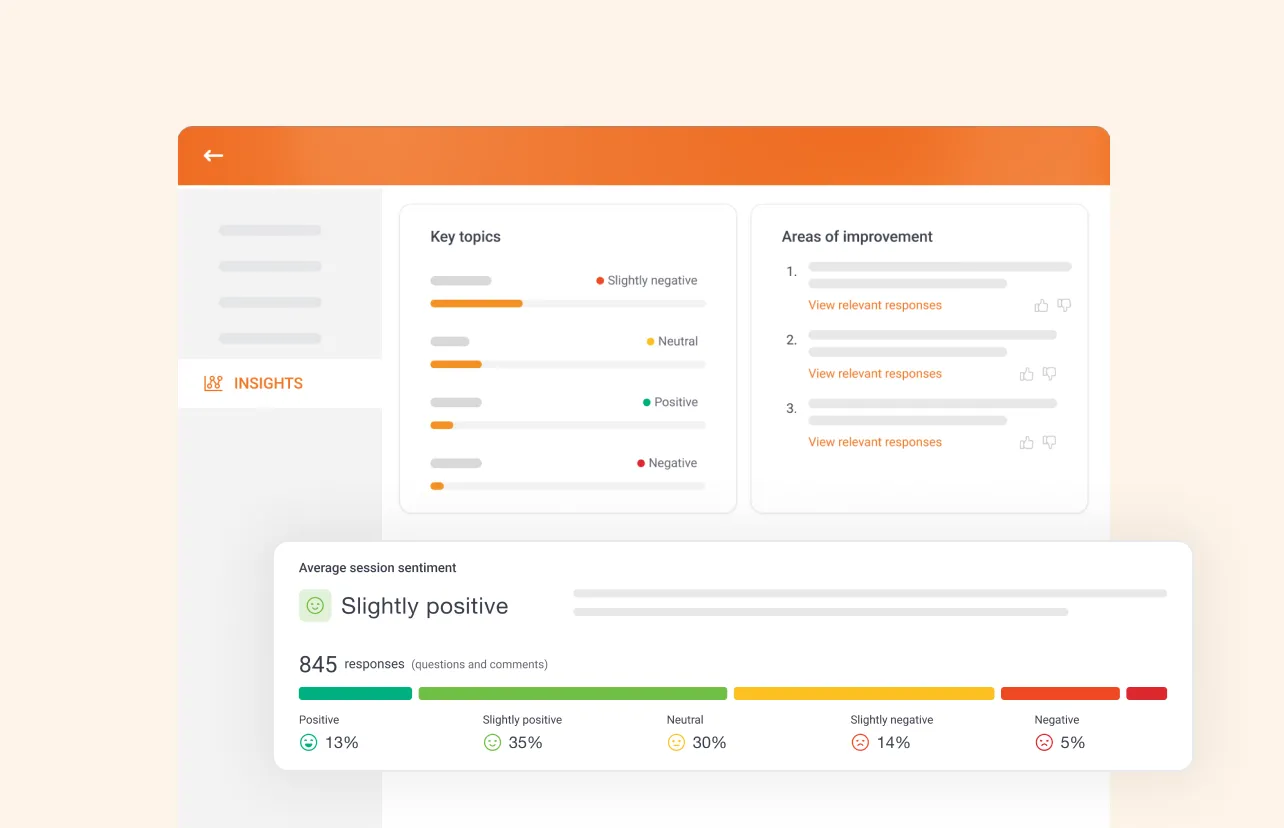
Uncover audience sentiment at scale
Go beyond questions and understand how your audience feels with AI Insights for Q&A.
Every question is analysed and rated from Positive to Negative, helping you uncover sentiment trends, recurring concerns and emerging themes across your sessions.
Perfect for understanding:
 Employee sentiment in Town Halls
- Customer feedback at events
- Learner concerns in classrooms
Note: AI Insights for Q&A is available for Enterprise plans only.
Track and understand audience responses
Every Poll and Survey comes with downloadable reports for both quick sharing and detailed analysis.
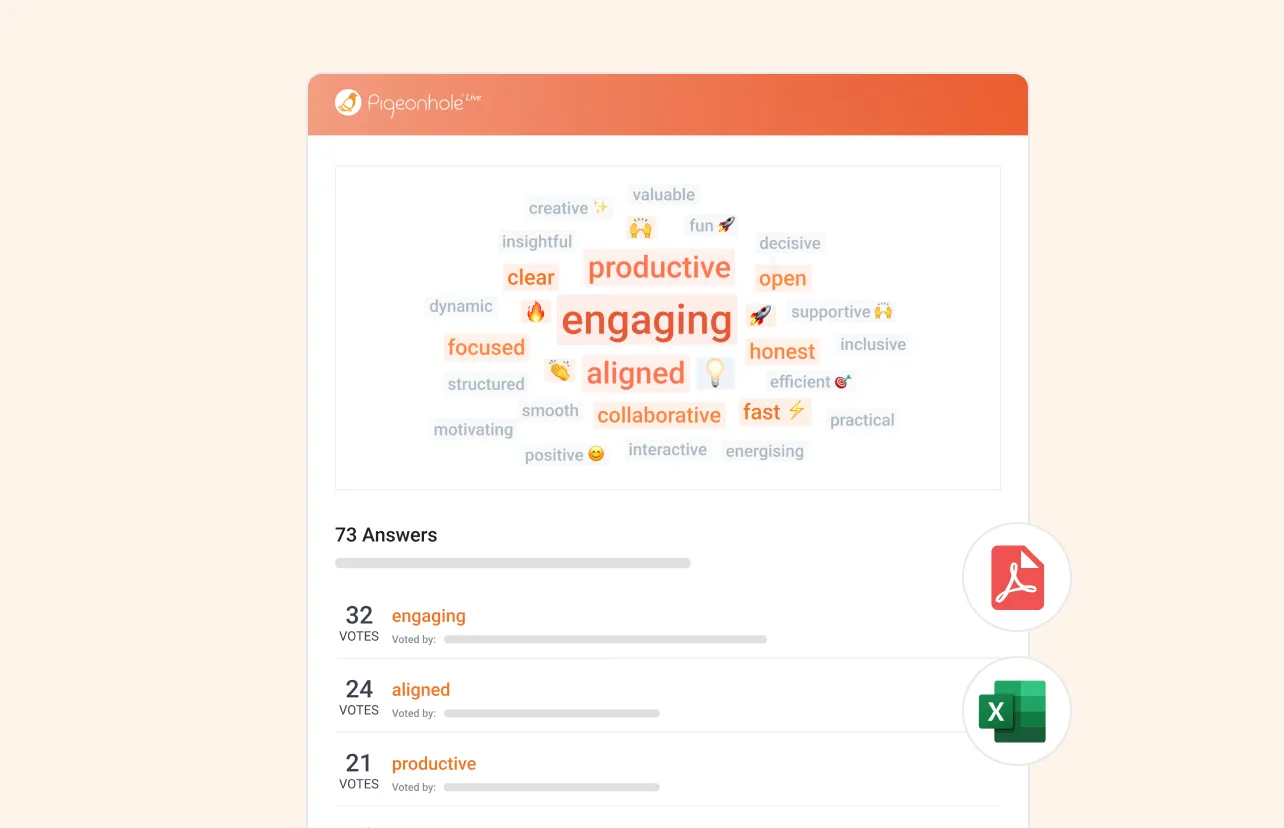
Visualise audience thinking with Word Clouds, review detailed responses from Open-ended Polls, and understand results across Multiple-choice, Rating and Ranking Polls.
When non-anonymous, responses can be attributable — helping you understand who said what and why.
Insights ready when you need them
View engagement insights as sessions happen, then quickly download and share reports with stakeholders, speakers and leadership teams.
Fast to access. Easy to understand. Ready to share.
- Real-time reporting
- Excel breakdowns
- PDF reports
- Attributable responses
See the bigger picture with Analytics
Track engagement, adoption and usage patterns across your Workspace.
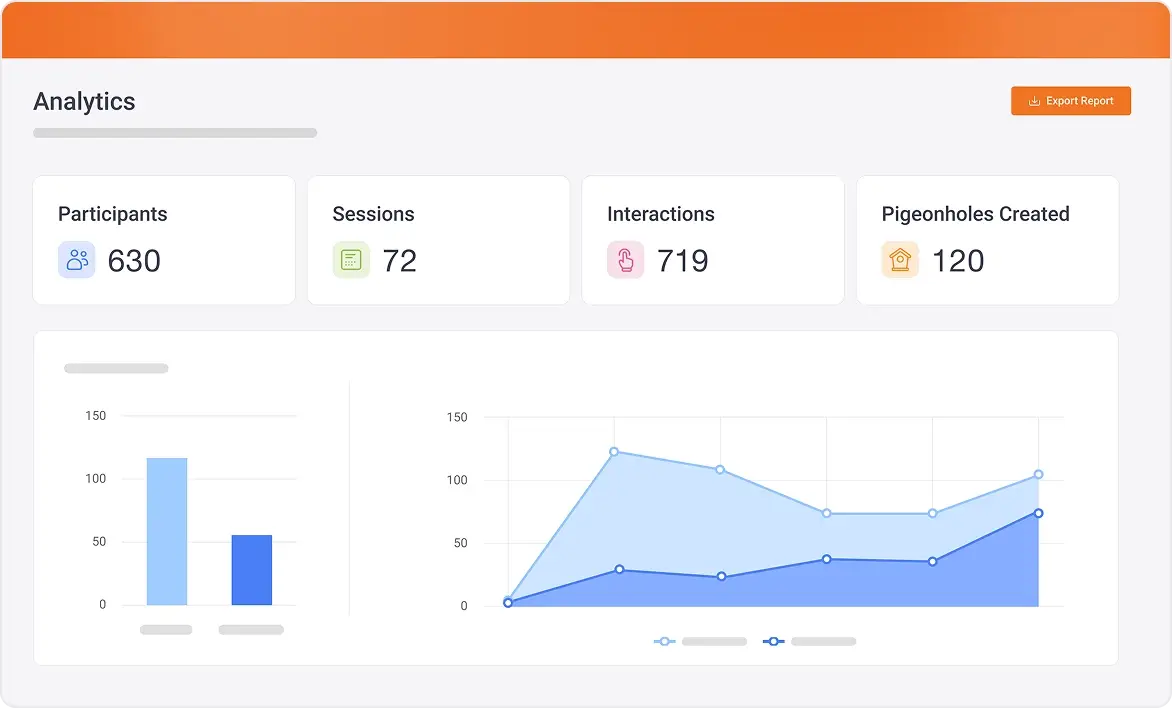
Workspace Analytics
See how teams across your organisation use Pigeonhole Live — from Pigeonholes created and sessions run, to feature usage and participation trends.
Understand what’s working, where adoption is growing, and where support may be needed.
Bring engagement into your BI tools
Use our public API to connect Pigeonhole Live with tools like Power BI and your existing event systems.
Combine engagement data with registration, CRM or event platform data for a richer understanding of your audience.
Explore the interactions behind the insights
Insights start with engagement. Discover the interactive features that help you ask questions, gather feedback and understand your audience.





Frequently asked questions
Pigeonhole Live helps you understand audience engagement across Q&A, Polls, Surveys, Chat and Reactions.
Track metrics such as participant count, questions submitted, votes received, poll responses, answer ratings, audience reactions and total interactions, all at the session level.
For Q&A, AI Insights can also uncover audience sentiment and recurring themes across submitted questions.
Yes. Pigeonhole Live updates Insights in real time, so you can monitor audience engagement while your presentation, meeting or event is still happening.
Track participation, responses, reactions and engagement trends live — helping organisers and speakers spot drop-offs, identify active moments and respond more effectively during the session.
Yes. Pigeonhole Live provides downloadable reports across Q&A, Polls, Surveys, Chat and Reactions.
Reports are available in PDF format for quick overviews and sharing, as well as Excel format for deeper analysis and response-level breakdowns.
For Word Clouds and Open-ended Polls, detailed reports include individual responses and vote counts. Non-anonymous responses can also be attributable.
Yes. Pigeonhole Live provides session-level insights, so you can track engagement separately across different presentations, meetings or agenda sessions.
See participation, Q&A activity, Poll responses, Reactions and interactions for each session individually — making it easier to understand what resonated most and compare engagement across sessions.
This is especially useful for conferences, Town Halls, webinars and classroom learning.
Yes. Pigeonhole Live offers a Public API so organisations can integrate engagement data into their existing event and reporting workflows.
You can synchronise registrant IDs from registration platforms, track meaningful audience participation, and export engagement data into BI tools like Power BI or internal dashboards alongside the rest of your customer and event data.
This is especially useful for enterprise teams and field marketing events looking for a unified view of engagement.
Pigeonhole Live's AI Insights for Q&A automatically analyses submitted audience questions to identify sentiment and recurring themes.
Questions are categorised across sentiment levels — from Positive to Negative — helping organisers better understand employee concerns, customer feedback or learner sentiment at scale.
AI Insights also identifies common themes, making it easier to spot trends and topics that deserve attention.
Note: AI Insights for Q&A is available for Enterprise plans only.
Understand what engaged your audience
Go beyond attendance numbers with session-level insights and Workspace-wide analytics.
Get started free